- Market Overview
- Futures
- Options
- Custom Charts
- Spread Charts
- Market Heat Maps
- Historical Data
- Stocks
- Real-Time Markets
- Site Register
- Mobile Website
- Trading Calendar
- Futures 101
- Commodity Symbols
- Real-Time Quotes
- CME Resource Center
- Farmer's Almanac
- USDA Reports
Can the Stock Market Continue to Rally?

I asked if the U.S. stock market could recover in an April 29, 2025, Barchart article. After falling to tariff-inspired lows on April 7, I concluded:
Even the most aggressive bull markets rarely move in straight lines. U.S. stocks have been in a bullish trend for years, and the odds favor an eventual resumption of the trend when the tariff situation ceases to cause the current level of uncertainty.
The bullish trend resumed over the past months, with the three leading indices rising to new all-time highs. With a more dovish Fed on the horizon for 2026 and increased clarity on tariffs, the odds favor a continuation of the bullish trend.
The leading indices’ performance since the Q2 closing levels
The leading U.S. stock market indices have moved mostly higher since the end of Q2 2025:
- The DJIA is the leading bellwether U.S. stock market index. After closing Q2 at 44,094.77, the index was 1.99% higher, trading at 44,971.66 on August 18.
- The S&P 500, the most diversified U.S. stock market index, closed at 6,204.95 on June 30, 2025, and was 3.9% higher at the 6,449.02 level on August 18.
- The tech-heavy NASDAQ has moved 6.09% higher from 20,369.73 at the end of Q2 2025 to 21,610.38 on August 11, 2025.
The DJIA, the bellwether index, the S&P 500, the most diversified U.S. stock market index, and the NASDAQ composite index, which reflects the technology sector, have posted impressive returns over the first half of Q3 2025.
The case for higher stocks over the second half of 2025
The case for high stock indices over the coming weeks and months includes:
- The Fed Funds Rate remains unchanged in 2025 at 4.375%. The inflation data, trade deals with global partners, and employment data suggest that lower rates are likely before the end of 2025. Lower short-term rates could support higher stock prices.
- Robust technology earnings beating forecasts support higher share prices.
- The leading stock market indices reached new record highs in Q3, with corrections over the past decades compelling buying opportunities.
- The trend in the stock market remains higher, and the trend is always a trader or investor’s best friend.
The reasons for caution
The factors that could cause stock market corrections include:
- The higher the stock prices rise, the greater the odds of a correction.
- U.S. tariffs continue to cause uncertainty, which could lead to periodic selloffs.
- The geopolitical landscape remains highly volatile, creating the potential for risk-off periods, sending stocks lower.
- Inflation data has ticked higher in July, validating some of the FOMC’s concerns about lowering rates.
- The most significant stock market selloffs occur from surprises that shock the system.
- The stock market tends to experience seasonal weakness in October.
The VIX index could be too low at under 20
The VIX index tends to rise when stocks fall and vice versa. The VIX index reflects the blended implied volatility of put and call options on the stocks comprising the S&P 500 index. The VIX’s current level below 16 reflects the S&P 500’s bullish price action.
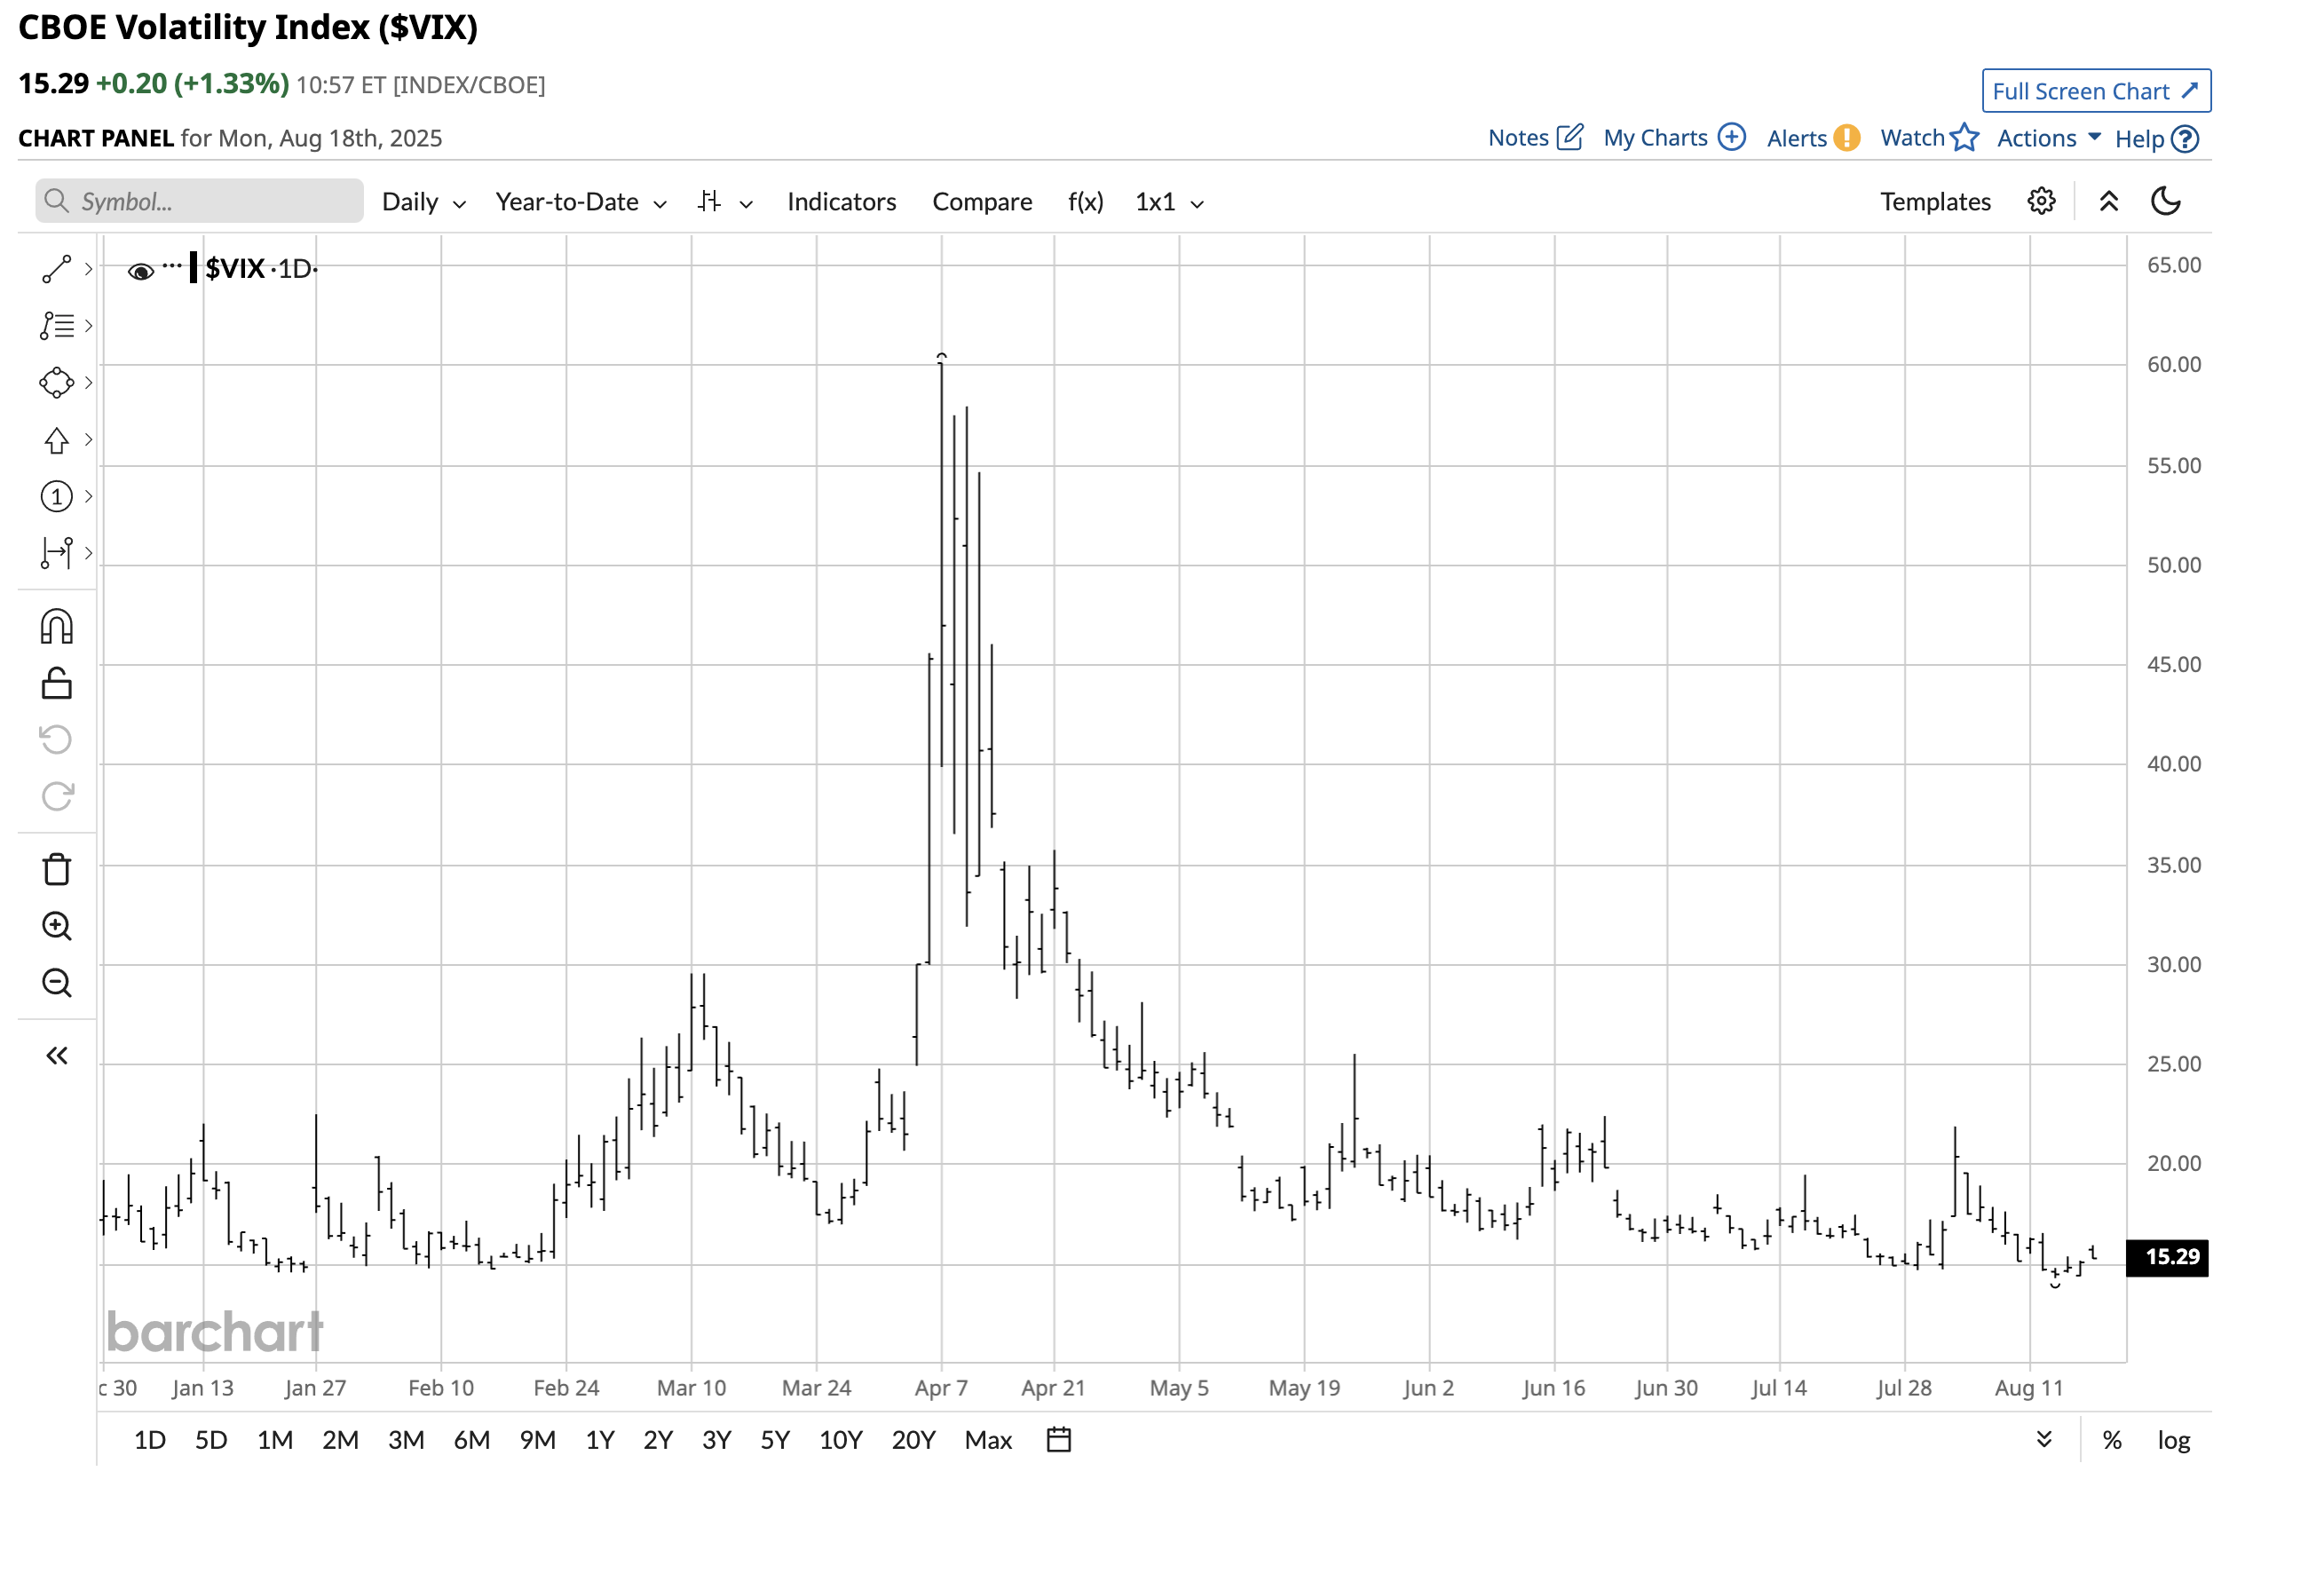
The daily year-to-date chart highlights the VIX’s 14.30 to 60.13 2025 range. At under 15.50, the VIX is just above the 2025 lows established last week at 14.30. Meanwhile, the sky-high level of stock prices increases the odds of a correction before the end of this year, suggesting that the VIX index is incredibly inexpensive at its current level.
Buying corrective dips continues to be optimal
Buying stocks during corrections has been a generally optimal strategy for decades.
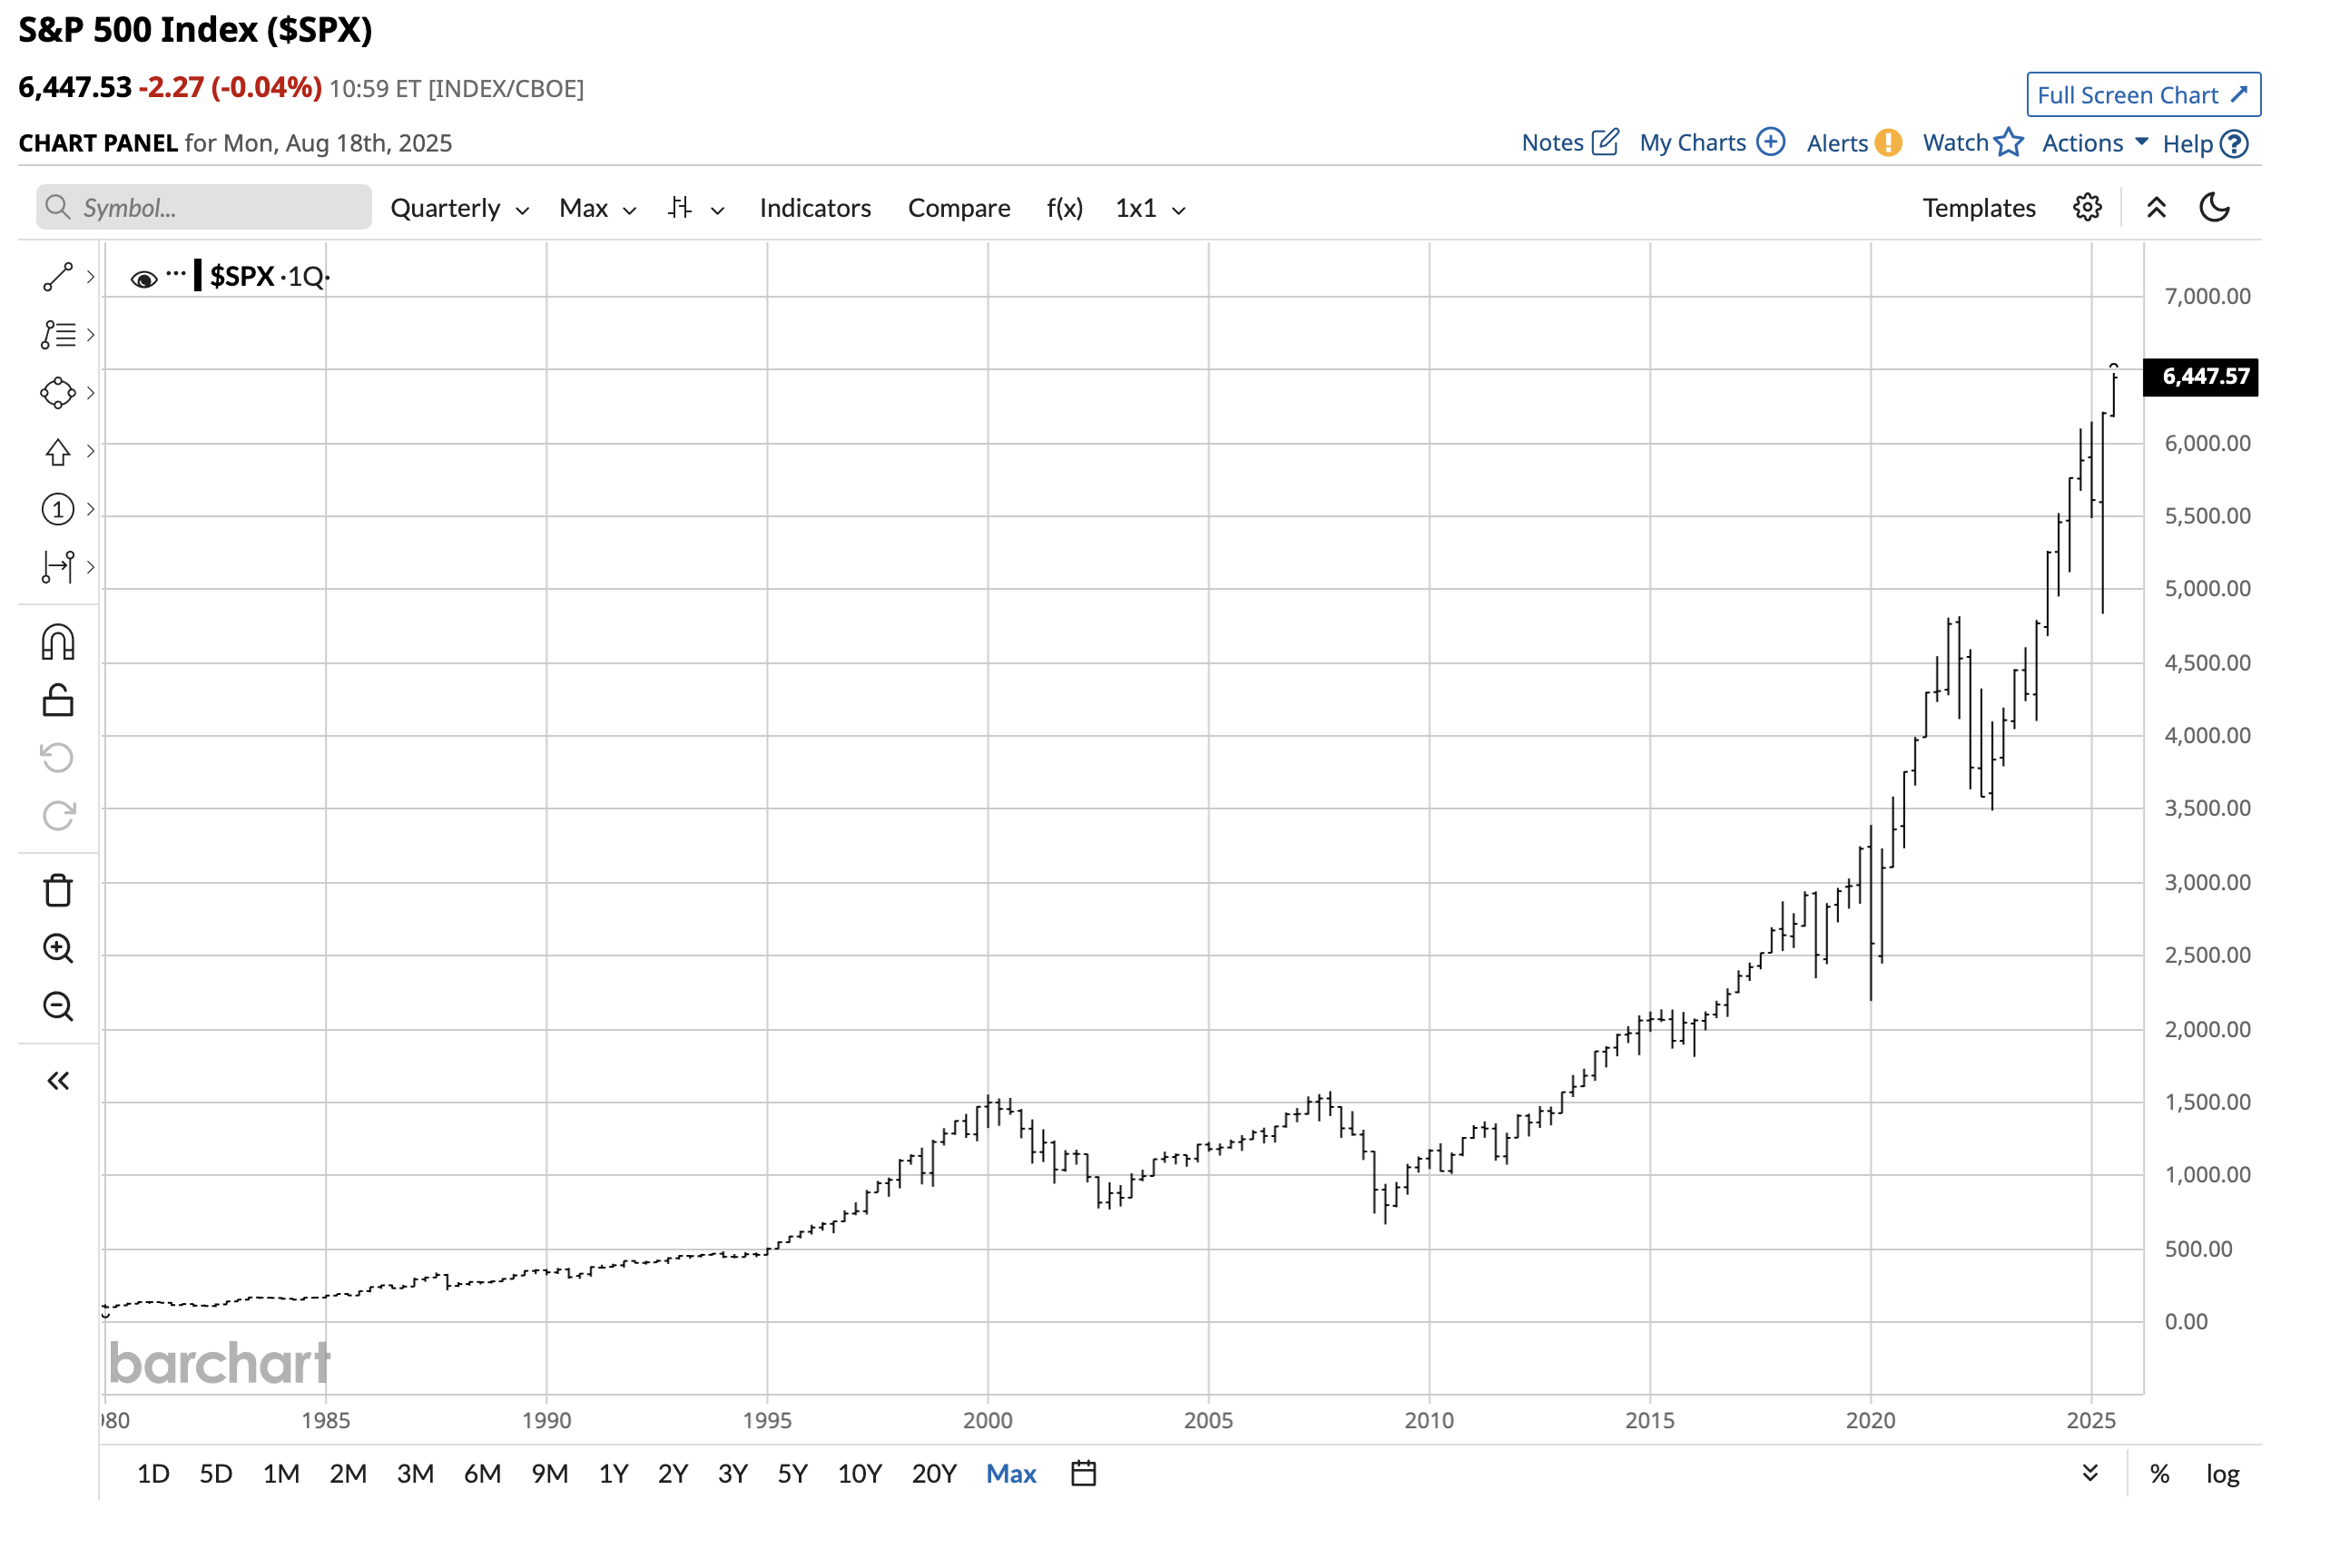
The quarterly chart dating back decades shows that each downside correction over the past four and a half decades has been a compelling buying opportunity. The greater the percentage dip, the more profitable a scale-down buying approach. The S&P 500 has made higher lows and higher highs for nearly half a century, with the index rising to a new record high in Q3 2025.
The bottom line is that the long-term trend is our best friend, and new higher highs are likely. While the risk of a correction is rising with share prices, a potential new buying opportunity could be just around the corner.
On the date of publication, Andrew Hecht did not have (either directly or indirectly) positions in any of the securities mentioned in this article. All information and data in this article is solely for informational purposes. For more information please view the Barchart Disclosure Policy here.